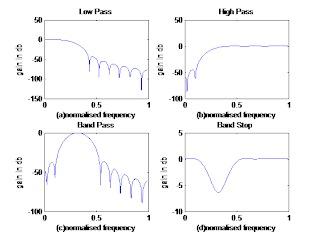
clear all;
close all;
format long;
rp=input('Enter the Passband Ripple:');
rs=input('Enter the Stopband Ripple:');
fp=input('Enter the Passband Frequency:');
fs=input('Enter the Stopband Frequency:');
f=input('Enter the Sampling Frequency:');
wp=2*fp/f;
ws=2*fs/f;
num=-20*log10(sqrt(rp*rs))-13;
dem=14.6*(fs-fp)/f;
n=ceil(num/dem);
n1=n+1;
if(rem(n,2)~=0)
n1=n;
n=n-1;
end
y=hanning(n1);
%Low Pass
b=fir1(n,wp,y);
[h,o]=freqz(b,1,256);
m=20*log10(abs(h));
subplot(221);
plot(o/pi,m);
ylabel('Gain in dB');
xlabel('(a)Normalised frequency');
title('Low Pass');
%High Pass
b=fir1(n,wp,'high',y);
[h,o]=freqz(b,1,256);
m=20*log10(abs(h));
subplot(222);
plot(o/pi,m);
ylabel('Gain in dB');
xlabel('(b)Normalised frequency');
title('High Pass');
%Band Pass
wn=[wp ws];
b=fir1(n,wn,y);
[h,o]=freqz(b,1,256);
m=20*log10(abs(h));
subplot(223);
plot(o/pi,m);
ylabel('Gain in dB');
xlabel('(c)Normalised frequency');
title('Band Pass');
%Band Stop
wn=[wp ws];
b=fir1(n,wn,'stop',y);
[h,o]=freqz(b,1,256);
m=20*log10(abs(h));
subplot(224);
plot(o/pi,m);
ylabel('Gain in dB');
xlabel('(d)Normalised frequency');
title('Band Stop’);
Input:
Enter the Passband Ripple:.01
Enter the Stopband Ripple:.2
Enter the Passband Frequency:1200
Enter the Stopband Frequency:1700
Enter the Sampling Frequency:9000
Output:

No comments:
Post a Comment