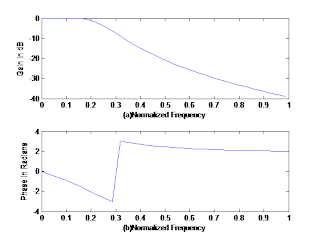
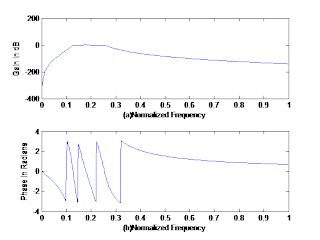
FILTERS USING KAISER WINDOW

clc;
clear all;
close all;
format long;
rp=input('Enter the passband ripple:');
rs=input('Eter the stopband ripple:');
fp=input('Enter the passband frequency:');
fs=input('Enter the stopband frequency:');
f=input('Enter the sampled frequency:');
beta=input('Enter Beta Value:');
wp=2*fp/f;
ws=2*fs/f;
num=-20*log10(sqrt(rp*rs))-13;
dem=14.6*(fs-fp)/f;
n=ceil(num/dem);
n1=n+1;
if(rem(n,2)~=0)
n1=n;
n=n-1;
end
y=kaiser(n1,beta);

%Low Pass

b=fir1(n,wp,y);
[h,o]=freqz(b,1,256);
m=20*log10(abs(h));
subplot(221);
plot(o/pi,m);
ylabel('gain in db');
xlabel('(a)normalised frequency');
title('Low Pass');

%High Pass

b=fir1(n,wp,'high',y);
[h,o]=freqz(b,1,256);
m=20*log10(abs(h));
subplot(222);
plot(o/pi,m);
ylabel('gain in db');
xlabel('(b)normalised frequency');
title('High Pass');

%Band Pass

wn=[wp ws];
b=fir1(n,wn,y);
[h,o]=freqz(b,1,256);
m=20*log10(abs(h));
subplot(223);
plot(o/pi,m);
ylabel('gain in db');
xlabel('(c)normalised frequency');
title('Band Pass');

%Band Stop

wn=[wp ws];
b=fir1(n,wn,'stop',y);
[h,o]=freqz(b,1,256);
m=20*log10(abs(h));
subplot(224);
plot(o/pi,m);
ylabel('gain in db');
xlabel('(d)normalised frequency');
title('Band Stop ');

Input:

Enter the Passband Ripple:.01
Enter the Stopband Ripple:.2
Enter the Passband Frequency:1200
Enter the Stopband Frequency:1700
Enter the Sampling Frequency:9000

Output:

FILTERS USING BLACKMAN WINDOW

clc;
clear all;
close all;
format long;
rp=input('Enter the passband ripple:');
rs=input('Eter the stopband ripple:');
fp=input('Enter the passband frequency:');
fs=input('Enter the stopband frequency:');
f=input('Enter the sampled frequency:');
wp=2*fp/f;
ws=2*fs/f;
num=-20*log10(sqrt(rp*rs))-13;
dem=14.6*(fs-fp)/f;
n=ceil(num/dem);
n1=n+1;
if(rem(n,2)~=0)
n1=n;
n=n-1;
end
y=blackman(n1);

%Low Pass

b=fir1(n,wp,y);
[h,o]=freqz(b,1,256);
m=20*log10(abs(h));
subplot(221);
plot(o/pi,m);
ylabel('gain in db');
xlabel('(a)normalised frequency');
title('Low Pass');

%High Pass

b=fir1(n,wp,'high',y);
[h,o]=freqz(b,1,256);
m=20*log10(abs(h));
subplot(222);
plot(o/pi,m);
ylabel('gain in db');
xlabel('(b)normalised frequency');
title('High Pass');

%Band Pass

wn=[wp ws];
b=fir1(n,wn,y);
[h,o]=freqz(b,1,256);
m=20*log10(abs(h));
subplot(223);
plot(o/pi,m);
ylabel('gain in db');
xlabel('(c)normalised frequency');
title('Band Pass');

%Band Stop

wn=[wp ws];
b=fir1(n,wn,'stop',y);
[h,o]=freqz(b,1,256);
m=20*log10(abs(h));
subplot(224);
plot(o/pi,m);
ylabel('gain in db');
xlabel('(d)normalised frequency');
title('Band Stop ');


Input:

Enter the Passband Ripple:.01
Enter the Stopband Ripple:.2
Enter the Passband Frequency:1200
Enter the Stopband Frequency:1700
Enter the Sampling Frequency:9000

Output:
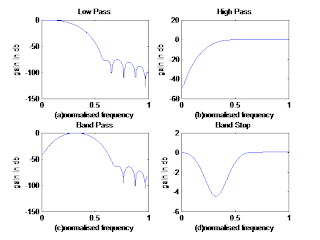
FILTERS USING TRIANGULAR WINDOW

clc;
clear all;
close all;
format long;
rp=input('Enter the passband ripple:');
rs=input('Eter the stopband ripple:');
fp=input('Enter the passband frequency:');
fs=input('Enter the stopband frequency:');
f=input('Enter the sampled frequency:');
wp=2*fp/f;
ws=2*fs/f;
num=-20*log10(sqrt(rp*rs))-13;
dem=14.6*(fs-fp)/f;
n=ceil(num/dem);
n1=n+1;
if(rem(n,2)~=0)
n1=n;
n=n-1;
end
y=bartlett(n1);

%Low Pass

b=fir1(n,wp,y);
[h,o]=freqz(b,1,256);
m=20*log10(abs(h));
subplot(221);
plot(o/pi,m);
ylabel('gain in db');
xlabel('(a)normalised frequency');
title('Low Pass');

%High Pass

b=fir1(n,wp,'high',y);
[h,o]=freqz(b,1,256);
m=20*log10(abs(h));
subplot(222);
plot(o/pi,m);
ylabel('gain in db');
xlabel('(b)normalised frequency');
title('High Pass');

%Band Pass

wn=[wp ws];
b=fir1(n,wn,y);
[h,o]=freqz(b,1,256);
m=20*log10(abs(h));
subplot(223);
plot(o/pi,m);
ylabel('gain in db');
xlabel('(c)normalised frequency');
title('Band Pass');

%Band Stop

wn=[wp ws];
b=fir1(n,wn,'stop',y);
[h,o]=freqz(b,1,256);
m=20*log10(abs(h));
subplot(224);
plot(o/pi,m);
ylabel('gain in db');
xlabel('(d)normalised frequency');
title('Band Stop ');


Input:


Enter the Passband Ripple:.01
Enter the Stopband Ripple:.2
Enter the Passband Frequency:1200
Enter the Stopband Frequency:1700
Enter the Sampling Frequency:9000

Output:


FILTERS USING RECTANGULAR WINDOW

clc;
clear all;
close all;
format long;
rp=input('Enter the passband ripple:');
rs=input('Eter the stopband ripple:');
fp=input('Enter the passband frequency:');
fs=input('Enter the stopband frequency:');
f=input('Enter the sampled frequency:');
wp=2*fp/f;
ws=2*fs/f;
num=-20*log10(sqrt(rp*rs));
dem=14.6*(fs-fp)/f;
n=ceil(num/dem);
n1=n+1;
if(rem(n,2)~=0)
n1=n;
n=n-1;
end
y=boxcar(n1);

%Low Pass

b=fir1(n,wp,y);
[h,o]=freqz(b,1,256);
m=20*log10(abs(h));
subplot(221);
plot(o/pi,m);
ylabel('gain in db');
xlabel('(a)normalised frequency');
title('Low Pass');

%High Pass

b=fir1(n,wp,'high',y);
[h,o]=freqz(b,1,256);
m=20*log10(abs(h));
subplot(222);
plot(o/pi,m);
ylabel('gain in db');
xlabel('(b)normalised frequency');
title('High Pass');

%Band Pass

wn=[wp ws];
b=fir1(n,wn,y);
[h,o]=freqz(b,1,256);
m=20*log10(abs(h));
subplot(223);
plot(o/pi,m);
ylabel('gain in db');
xlabel('(c)normalised frequency');
title('Band Pass');

%Band Stop

wn=[wp ws];
b=fir1(n,wn,'stop',y);
[h,o]=freqz(b,1,256);
m=20*log10(abs(h));
subplot(224);
plot(o/pi,m);
ylabel('gain in db');
xlabel('(d)normalised frequency');
title('Band Stop ');


Input:

Enter the Passband Ripple:.01
Enter the Stopband Ripple:.2
Enter the Passband Frequency:1200
Enter the Stopband Frequency:1700
Enter the Sampling Frequency:9000

Output:

FILTERS USING HANNING WINDOW

clc;
clear all;
close all;
format long;
rp=input('Enter the Passband Ripple:');
rs=input('Enter the Stopband Ripple:');
fp=input('Enter the Passband Frequency:');
fs=input('Enter the Stopband Frequency:');
f=input('Enter the Sampling Frequency:');
wp=2*fp/f;
ws=2*fs/f;
num=-20*log10(sqrt(rp*rs))-13;
dem=14.6*(fs-fp)/f;
n=ceil(num/dem);
n1=n+1;
if(rem(n,2)~=0)
n1=n;
n=n-1;
end
y=hanning(n1);

%Low Pass

b=fir1(n,wp,y);
[h,o]=freqz(b,1,256);
m=20*log10(abs(h));
subplot(221);
plot(o/pi,m);
ylabel('Gain in dB');
xlabel('(a)Normalised frequency');
title('Low Pass');

%High Pass

b=fir1(n,wp,'high',y);
[h,o]=freqz(b,1,256);
m=20*log10(abs(h));
subplot(222);
plot(o/pi,m);
ylabel('Gain in dB');
xlabel('(b)Normalised frequency');
title('High Pass');

%Band Pass

wn=[wp ws];
b=fir1(n,wn,y);
[h,o]=freqz(b,1,256);
m=20*log10(abs(h));
subplot(223);
plot(o/pi,m);
ylabel('Gain in dB');
xlabel('(c)Normalised frequency');
title('Band Pass');

%Band Stop

wn=[wp ws];
b=fir1(n,wn,'stop',y);
[h,o]=freqz(b,1,256);
m=20*log10(abs(h));
subplot(224);
plot(o/pi,m);
ylabel('Gain in dB');
xlabel('(d)Normalised frequency');
title('Band Stop’);

Input:

Enter the Passband Ripple:.01
Enter the Stopband Ripple:.2
Enter the Passband Frequency:1200
Enter the Stopband Frequency:1700
Enter the Sampling Frequency:9000

Output:
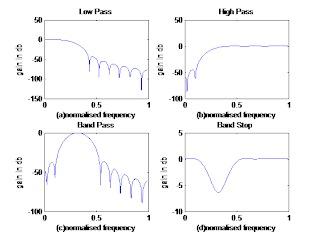
FILTERS USING HAMMING WINDOW

clc;
clear all;
close all;
format long;
rp=input('Enter the Passband Ripple:');
rs=input('Enter the Stopband Ripple:');
fp=input('Enter the Passband Frequency:');
fs=input('Enter the Stopband Frequency:');
f=input('Enter the Sampling Frequency:');
wp=2*fp/f;
ws=2*fs/f;
num=-20*log10(sqrt(rp*rs));
dem=14.6*(fs-fp)/f;
n=ceil(num/dem);
n1=n+1;
if(rem(n,2)~=0)
n1=n;
n=n-1;
end
y=hamming(n1);

%Low Pass

b=fir1(n,wp,y);
[h,o]=freqz(b,1,256);
m=20*log10(abs(h));
subplot(221);
plot(o/pi,m);
ylabel('Gain in dB');
xlabel('(a)Normalised frequency');
title('Low Pass');

%High Pass

b=fir1(n,wp,'high',y);
[h,o]=freqz(b,1,256);
m=20*log10(abs(h));
subplot(222);
plot(o/pi,m);
ylabel('Gain in dB');
xlabel('(b)Normalised frequency');
title('High Pass');

%Band Pass

wn=[wp,ws];
b=fir1(n,wn,y);
[h,o]=freqz(b,1,256);
m=20*log10(abs(h));
subplot(223);
plot(o/pi,m);
ylabel('Gain in dB');
xlabel('(c)Normalised frequency');
title('Band Pass');

%Band Stop

wn=[wp,ws];
b=fir1(n,wn,'stop',y);
[h,o]=freqz(b,1,256);
m=20*log10(abs(h));
subplot(224);
plot(o/pi,m);
ylabel('Gain in dB');
xlabel('(d)Normalised frequency');
title('Band Stop’);

Input:


Enter the Passband Ripple:.01
Enter the Stopband Ripple:.2
Enter the Passband Frequency:1200
Enter the Stopband Frequency:1700
Enter the Sampling Frequency:9000

Output:

CHEBYSHEV TYPE-II STOPBAND FILTER

clc;
clear all;
close all;
format long;
rp=input('Enter the Passband Ripple:');
rs=input('Enter the Stopband Ripple:');
wp=input('Enter the Passband Frequency:');
ws=input('Enter the Stopband Frequency:');
fs=input('Enter the Sampling Frequency:');
w1=2*wp/fs;
w2=2*ws/fs;
[n,wn]=cheb2ord(w1,w2,rp,rs,'s');
wn=[w1,w2];
[b,a]=cheby2(n,rp,wn,'stop','s');
w=0:0.1:pi;
[h,om]=freqs(b,a,w);
m=20*log10(abs(h));
an=angle(h);
subplot(2,1,1);
plot(om/pi,m);
ylabel('gain in db');
xlabel('(a)normalised frequency');
subplot(2,1,2);
plot(om/pi,an);
ylabel('phase in radians');
xlabel('(b)normalised frequency');

Input:


Enter the Passband Ripple:.01
Enter the Stopband Ripple:20
Enter the Passband Frequency:1000
Enter the Stopband Frequency:2000
Enter the Sampling Frequency:5000

Output:

CHEBYSHEV TYPE-II BANDPASS FILTER

clc;
clear all;
close all;
format long;
rp=input('Enter the Passband Ripple:');
rs=input('Enter the Stopband Ripple:');
wp=input('Enter the Passband Frequency:');
ws=input('Enter the Stopband Frequency:');
fs=input('Enter the Sampling Frequency:');
w1=2*wp/fs;
w2=2*ws/fs;
[n,wn]=cheb2ord(w1,w2,rp,rs,'s');
wn=[w1,w2];
[b,a]=cheby2(n,rp,wn,'bandpass','s');
w=0:0.1:pi;
[h,om]=freqs(b,a,w);
m=20*log10(abs(h));
an=angle(h);
subplot(2,1,1);
plot(om/pi,m);
ylabel('gain in db');
xlabel('(a)normalised frequency');
subplot(2,1,2);
plot(om/pi,an);
ylabel('phase in radians');
xlabel('(b)normalised frequency');

Input:

Enter the Passband Ripple:.01
Enter the Stopband Ripple:20
Enter the Passband Frequency:1000
Enter the Stopband Frequency:2000
Enter the Sampling Frequency:5000

Output:


CHEBYSHEV TYPE-II HIGH PASS FILTER

clc;
clear all;
close all;
format long;
rp=input('Enter the Passband Ripple:');
rs=input('Enter the Stopband Ripple:');
wp=input('Enter the Passband Frequency:');
ws=input('Enter the Stopband Frequency:');
fs=input('Enter the Sampling Frequency:');
w1=2*wp/fs;
w2=2*ws/fs;
[n,wn]=cheb2ord(w1,w2,rp,rs,'s');
[b,a]=cheby2(n,rp,wn,'high','s');
w=0:0.1:pi;
[h,om]=freqs(b,a,w);
m=20*log10(abs(h));
an=angle(h);
subplot(2,1,1);
plot(om/pi,m);
ylabel('Gain in dB');
xlabel('(a)Normalized Frequency');
subplot(2,1,2);
plot(om/pi,an);
ylabel('Phase in Radians');
xlabel('(b)Normalized Frequency');

Input:

Enter the Passband Ripple:.1
Enter the Stopband Ripple:20
Enter the Passband Frequency:1000
Enter the Stopband Frequency:10000
Enter the Sampling Frequency:5000

Output:

CHEBYSHEV TYPE-II LOW PASS FILTER

clc;
clear all;
close all;
format long;
rp=input('Enter the Passband Ripple:');
rs=input('Enter the Stopband Ripple:');
wp=input('Enter the Passband Frequency:');
ws=input('Enter the Stopband Frequency:');
fs=input('Enter the Sampling Frequency:');
w1=2*wp/fs;
w2=2*ws/fs;
[n,wn]=cheb2ord(w1,w2,rp,rs,'s');
[b,a]=cheby2(n,rp,wn,'low','s');
w=0:0.1:pi;
[h,om]=freqs(b,a,w);
m=20*log10(abs(h));
an=angle(h);
subplot(2,1,1);
plot(om/pi,m);
ylabel('Gain in dB');
xlabel('(a)Normalized Frequency');
subplot(2,1,2);
plot(om/pi,an);
ylabel('Phase in Radians');
xlabel('(b)Normalized Frequency');

Input:

Enter the Passband Ripple:.01
Enter the Stopband Ripple:20
Enter the Passband Frequency:1000
Enter the Stopband Frequency:10000
Enter the Sampling Frequency:5000

Output:

CHEBYSHEV TYPE-I STOPBAND FILTER

clc;
clear all;
close all;
format long;
rp=input('Enter the Passband Ripple:');
rs=input('Enter the Stopband Ripple:');
wp=input('Enter the Passband Frequency:');
ws=input('Enter the Stopband Frequency:');
fs=input('Enter the Sampling Frequency:');
w1=2*wp/fs;
w2=2*ws/fs;
[n,wn]=cheb1ord(w1,w2,rp,rs,'s');
wn=[w1,w2];
[b,a]=cheby1(n,rp,wn,'stop','s');
w=0:0.1:pi;
[h,om]=freqs(b,a,w);
m=20*log10(abs(h));
an=angle(h);
subplot(2,1,1);
plot(om/pi,m);
ylabel('Gain in dB');
xlabel('(a)Normalized Frequency');
subplot(2,1,2);
plot(om/pi,an);
ylabel('Phase in Radians');
xlabel('(b)Normalized Frequency');

Input:

Enter the Passband Ripple:.01
Enter the Stopband Ripple:20
Enter the Passband Frequency:1000
Enter the Stopband Frequency:2000
Enter the Sampling Frequency:5000

Output:

CHEBYSHEV TYPE-I BANDPASS FILTER

clc;
clear all;
close all;
format long;
rp=input('Enter the Passband Ripple:');
rs=input('Enter the Stopband Ripple:');
wp=input('Enter the Passband Frequency:');
ws=input('Enter the Stopband Frequency:');
fs=input('Enter the Sampling Frequency:');
w1=2*wp/fs;
w2=2*ws/fs;
[n,wn]=cheb1ord(w1,w2,rp,rs,'s');
wn=[w1,w2];
[b,a]=cheby1(n,rp,wn,'bandpass','s');
w=0:0.1:pi;
[h,om]=freqs(b,a,w);
m=20*log10(abs(h));
an=angle(h);
subplot(2,1,1);
plot(om/pi,m);
ylabel('Gain in dB');
xlabel('(a)Normalized Frequency');
subplot(2,1,2);
plot(om/pi,an);
ylabel('Phase in Radians');
xlabel('(b)Normalized Frequency');


Input:

Enter the Passband Ripple:.01
Enter the Stopband Ripple:20
Enter the Passband Frequency:1000
Enter the Stopband Frequency:2000
Enter the Sampling Frequency:5000

Output:

CHEBYSHEV TYPE-I HIGH PASS FILTER

clc;
clear all;
close all;
format long;
rp=input('Enter the Passband Ripple:');
rs=input('Enter the Stopband Ripple:');
wp=input('Enter the Passband Frequency:');
ws=input('Enter the Stopband Frequency:');
fs=input('Enter the Sampling Frequency:');
w1=2*wp/fs;
w2=2*ws/fs;
[n,wn]=cheb1ord(w1,w2,rp,rs,'s');
[b,a]=cheby1(n,rp,wn,'high','s');
w=0:0.1:pi;
[h,om]=freqs(b,a,w);
m=20*log10(abs(h));
an=angle(h);
subplot(2,1,1);
plot(om/pi,m);
ylabel('Gain in dB');
xlabel('(a)Normalized Frequency');
subplot(2,1,2);
plot(om/pi,an);
ylabel('Phase in Radians');
xlabel('(b)Normalized Frequency');

Input:


Enter the Passband Ripple:.1
Enter the Stopband Ripple:20
Enter the Passband Frequency:1000
Enter the Stopband Frequency:10000
Enter the Sampling Frequency:5000

Output:

CHEBYSHEV TYPE-I LOW PASS FILTER

clc;
clear all;
close all;
format long;
rp=input('Enter the Passband Ripple:');
rs=input('Enter the Stopband Ripple:');
wp=input('Enter the Passband Frequency:');
ws=input('Enter the Stopband Frequency:');
fs=input('Enter the Sampling Frequency:');
w1=2*wp/fs;
w2=2*ws/fs;
[n,wn]=cheb1ord(w1,w2,rp,rs,'s');
[b,a]=cheby1(n,rp,wn,'low','s');
w=0:0.1:pi;
[h,om]=freqs(b,a,w);
m=20*log10(abs(h));
an=angle(h);
subplot(2,1,1);
plot(om/pi,m);
ylabel('Gain in dB');
xlabel('(a)Normalized Frequency');
subplot(2,1,2);
plot(om/pi,an);
ylabel('Phase in Radians');
xlabel('(b)Normalized Frequency');

Input:

Enter the Passband Ripple:.01
Enter the Stopband Ripple:20
Enter the Passband Frequency:1000
Enter the Stopband Frequency:10000
Enter the Sampling Frequency:5000

Output:

CONVERSION OF ANALOG FILTER TO DIGITAL FILTER USING BILINEAR TRANSFORMATION

clc;
close all;
clear all;
b=input('Enter the Co-efficient of Numerator:');
a=input('Enter the Co-efficient of Denomintor:');
fs=input('Enter the Sampling Frequnecy:');
[bz,az]=bilinear(b,a,fs);[bz],[az]

Input:


Enter the Co-efficient of Numerator:[2]
Enter the Co-efficient of Denomintor:[1 4 3]
Enter the Sampling Frequnecy:10

Output:

bz =

0.0041 0.0083 0.0041


az =

1.0000 -1.6439 0.6687

CONVERSION OF ANALOG FILTER TO DIGITAL FILTER USING IMPULSE INVARIANT TRANSFORMATION

clc;
close all;
clear all;
b=input('Enter the Co-efficient of Numerator:');
a=input('Enter the Co-efficient of Denomintor:');
fs=input('Enter the Sampling Frequnecy:');
[bz,az]=impinvar(b,a,fs);[bz],[az]

Input:

Enter the Co-efficient of Numerator:[1]
Enter the Co-efficient of Denomintor:[1 3 2]
Enter the Sampling Frequnecy:1

Output:

bz =

0 0.2325


az =

1.0000 -0.5032 0.0498

BUTTERWORTH STOPBAND FILTER

clc;
clear all;
close all;
format long;
rp=input('Enter Passband Ripple:');
rs=input('Enter Stopband Ripple:');
wp=input('Enter Passband Frequency:');
ws=input('Enter Stopband Frequency:');
fs=input('Enter Sampling Frequency:');
w1=2*wp/fs;
w2=2*ws/fs;
[n,wn]=buttord(w1,w2,rp,rs,'s')
wn=[w1,w2];
[b,a]=butter(n,wn,'stop','s')
w=0:0.01:pi;
[h,om]=freqs(b,a,w);
m=20*log10(abs(h));
an=angle(h);
subplot(2,1,1);
plot(om/pi,m);
ylabel('Gain in dB');
xlabel('(a)Normalized Frequency');
subplot(2,1,2);
plot(om/pi,an);
ylabel('Phase in Radians');
xlabel('(b)Normalized Frequency');

Input:


Enter Passband Ripple:.01
Enter Stopband Ripple:20
Enter Passband Frequency:1000
Enter Stopband Frequency:2000
Enter Sampling Frequency:5000

Output:

BUTTERWORTH PASSBAND FILTER

clc;
clear all;
close all;
format long;
rp=input('Enter Passband Ripple:');
rs=input('Enter Stopband Ripple:');
wp=input('Enter Passband Frequency:');
ws=input('Enter Stopband Frequency:');
fs=input('Enter Sampling Frequency:');
w1=2*wp/fs;
w2=2*ws/fs;
[n,wn]=buttord(w1,w2,rp,rs,'s')
wn=[w1,w2];
[b,a]=butter(n,wn,'bandpass','s')
w=0:0.01:pi;
[h,om]=freqs(b,a,w);
m=20*log10(abs(h));
an=angle(h);
subplot(2,1,1);
plot(om/pi,m);
ylabel('Gain in dB');
xlabel('(a)Normalized Frequency');
subplot(2,1,2);
plot(om/pi,an);
ylabel('Phase in Radians');
xlabel('(b)Normalized Frequency');

Input:


Enter Passband Ripple:.01
Enter Stopband Ripple:20
Enter Passband Frequency:1000
Enter Stopband Frequency:2000
Enter Sampling Frequency:5000

Output:

BUTTERWORTH LOW PASS FILTER

clc;
clear all;
close all;
format long;
rp=input('Enter Passband Ripple:');
rs=input('Enter Stopband Ripple:');
wp=input('Enter Passband Frequency:');
ws=input('Enter Stopband Frequency:');
fs=input('Enter Sampling Frequency:');
w1=2*wp/fs;
w2=2*ws/fs;
[n,wn]=buttord(w1,w2,rp,rs,'s')
[b,a]=butter(n,wn,'low','s')
w=0:0.1:pi;
[h,om]=freqs(b,a,w);
m=20*log10(abs(h));
an=angle(h);
subplot(2,1,1);
plot(om/pi,m);
ylabel('Gain in dB');
xlabel('(a)Normalized Frequency');
subplot(2,1,2);
plot(om/pi,an);
ylabel('Phase in Radians');
xlabel('(b)Normalized Frequency');

Input:

Enter Passband Ripple:.01
Enter Stopband Ripple:20
Enter Passband Frequency:1000
Enter Stopband Frequency:10000
Enter Sampling Frequency:5000

Output:

BUTTERWORTH HIGH PASS FILTER

clc;
clear all;
close all;
format long;
rp=input('Enter Passband Ripple:');
rs=input('Enter Stopband Ripple:');
wp=input('Enter Passband Frequency:');
ws=input('Enter Stopband Frequency:');
fs=input('Enter Sampling Frequency:');
w1=2*wp/fs;
w2=2*ws/fs;
[n,wn]=buttord(w1,w2,rp,rs,'s')
[b,a]=butter(n,wn,'high','s')
w=0:0.01:pi;
[h,om]=freqs(b,a,w);
m=20*log10(abs(h));
an=angle(h);
subplot(2,1,1);
plot(om/pi,m);
ylabel('Gain in dB');
xlabel('(a)Normalized Frequency');
subplot(2,1,2);
plot(om/pi,an);
ylabel('Phase in Radians');
xlabel('(b)Normalized Frequency');

Input:

Enter Passband Ripple:.1
Enter Stopband Ripple:20
Enter Passband Frequency:1000
Enter Stopband Frequency:10000
Enter Sampling Frequency:5000

Output:


COMPARISION OF CIRCULAR AND LINEAR CONVOLUTIONS

clc;
close all;
clear all;
a1= input('1st sequence x:');
b1= input('2nd sequence h:');
q=conv(a1,b1);q
subplot(224);
stem(q);
title('Linear Convolution');
ax=length(a1);
bx=length(b1);
n=max(ax,bx);
n3=ax-bx;
if(n3<=0)
a1=[a1,zeros(1,-n3)];
else
b1=[b1,zeros(1,n3)];
end
for r=1:n
y(r)=0;
for i=1:n
j=r-i+1
if j<=0
j=j+n;
end
y(r)=y(r)+b1(j)*a1(i);
end
end
subplot(221);
stem(a1);a1
xlabel('n');
ylabel('a(n)');
title('first sequence');
subplot(222);
stem(b1);b1
xlabel('n');
ylabel('b(n)');
title('second sequence');
subplot(223);
stem(y);
xlabel('n');
ylabel('y(n)');
title('circular convolution sequence');
disp('the resultant signal is:');y

Input:


1st Sequence x:[1 2 3 4]
2nd Sequence h:[1 2]

Output:


q =

1 4 7 10 8

a1 =

1 2 3 4

b1 =

1 2 0 0

the resultant signal is:

y =

9 4 7 10

CIRCULAR CONVOLUTION OF TWO SEQUENCES

clc;
close all;
clear all;
a1= input('1st Sequence x:');
b1= input('2nd Sequence h:');
ax=length(a1);
bx=length(b1);
n=max(ax,bx);
n3=ax-bx;
if(n3<=0)
a1=[a1,zeros(1,-n3)];
else
b1=[b1,zeros(1,n3)];
end
for r=1:n
y(r)=0;
for i=1:n
j=r-i+1
if j<=0
j=j+n;
end
y(r)=y(r)+b1(j)*a1(j);
end
end
subplot(3,1,1);
stem(a1);a1
xlabel('n');
ylabel('a(n)');
title('first sequence');
subplot(3,1,2);
stem(b1);b1
xlabel('n');
ylabel('b(n)');
title('second sequence');
subplot(3,1,3);
stem(y);
xlabel('n');
ylabel('y(n)');
title('circular convolution sequence');
disp('The resultant signal is:');y


Input:

1st Sequence x:[1 2 3 4]
2nd Sequence h:[1 2]

Output:

a1 =

1 2 3 4


b1 =

1 2 0 0

The resultant signal is:

y =

5 5 5 5

LINEAR CONVOLUTION OF TWO SEQUENCES

clc;
close all;
clear all;
x=input('Enter Sequence x:');
h=input('Enter Sequence h:');
y=conv(x,h);
subplot(3,1,1);
stem(x);
axis([0 4 0 10])
grid on;
xlabel('n');
ylabel('x(n)');
subplot(3,1,2);
stem(h);
axis([0 4 0 10])
grid on;
xlabel('n');
ylabel('h(n)');
subplot(3,1,3);
stem(y);
xlabel('n');
ylabel('y(n)');
axis([0 10 0 30])
grid on;
title('Linear Convolution');
disp('The resultant signal is');y

Input:

Enter Sequence x:[1 2 3 4]
Enter Sequence h:[4 3 2 1]


Output:


y =

4 11 20 30 20 11 4

FAST FOURIER TRANSFORM

clc;
clear all;
close all;
x=input('Enter the Sequence:');
n=input('Enter the Length:');
y=fft(x,n);
subplot(221);
stem(x);x
xlabel('Time');
ylabel('Amplitude');
title('Input Sequence');
subplot(222);
stem(y);y
xlabel('Real Axis');
ylabel('Imaginary Axis');
title('FFT Sequence');
subplot(223);
stem(abs(y));abs(y)
xlabel('Frequency');
ylabel('Magnitude');
title('Magnitude Response');
subplot(224);
stem(angle(y));angle(y)
xlabel('Frequency');
ylabel('Phase');
title('Phase Response');

Input:

Enter the Sequence:[1 0 1 0 1 0 1 0]
Enter the Length:8

Output:


x =

1 0 1 0 1 0 1 0


y =

4 0 0 0 4 0 0 0


ans =

4 0 0 0 4 0 0 0


ans =

0 0 0 0 0 0 0 0

DISCRETE FOURIER TRANSFORM

clc;
close all;
clear all;
x=input('Enter the Input Sequence:')
N=length(x);
j=sqrt(-1);
stem(x);x
title('Given Sequence');
xlabel('n');
ylabel('amp');
pause;
for r=0:2
for n=1:N
x(r*N+n)=x(n);
t(r*N+n)=r*N+n;
end
end
for k=1:N
y(k)=0;
for n=1:N
p=(j*2*pi*(n-1)*(k-1))/N;
y(k)=y(k)+[x(n)*exp(-p)];
end
end
subplot(3,1,1);
stem(y);y
title('Discrete Fourier Transform');
xlabel('k');
ylabel('amp');
subplot(3,1,2);
stem(abs(y));abs(y)
title('Magnitude of Discrete Fourier Transform');
xlabel('k');
ylabel('amp');
subplot(3,1,3);
stem(atan2(imag(y),real(y)));atan2(imag(y),real(y))
title('Phase of Discrete Fourier Transform');
xlabel('k');
ylabel('angle');

Input:


Enter the Input Sequence:[1 0 1 0 1 0 1 0]

Output:

DISCRETE FOURIER SERIES

clc;
close all;
clear all;
x= input('Enter the Sequence:');
[S,N]= size(x);
w=exp(-i*2*pi/N);
for r= 0:2
for n=1:N-1
x(r*N+n)=x(n)
T(r*N+n)=r*N+n
end
end
subplot(3,1,1);
stem(T,x)
xlabel('Time');
ylabel('Amplitude');
title('Given Signal');
for k=1:3*n
x(k)= 0
for n=1:N-1
x(k)= x(k) +x(n)*w^[(k-1)*(n-1)];
end
end
subplot(3,1,2);
stem(T,abs(x));
xlabel('k');
ylabel('x(k)');
title('Discrete Fourier Series Magnitude Plot:');
subplot(3,1,3);
stem(T,angle(x));
xlabel('k');
ylabel('x(k)');
title('Discrete Fourier Series Phase Plot:');

Input:

Enter the Sequence:[1 2 3 3]

Output:

GENERATION OF ALL SIGNALS

clc;
close all;
clear all;
t=0:.001:2*pi;
y=10*sin(t);
subplot(3,2,1);
plot(t,y);
xlabel('Time');
ylabel('Amplitude');
title('Sinusoidal Wave');
a=0:10;
subplot(3,2,2);
plot(a,a);
xlabel('Time');
ylabel('Amplitude');
title('Ramp Function');
t=0:.01:6;
y=10*exp(t);
subplot(3,2,3);
plot(t,y);
xlabel('Time');
ylabel('Amplitude');
title('Exponential Function');
z=5*exp(-t);
subplot(3,2,4);
plot(t,z);
xlabel('Time');
ylabel('Amplitude');
title('Exponential Function');
x=0:1:6;
y=1.^x;
subplot(3,2,5);
plot(x,y);
xlabel('Time');
ylabel('Amplitude');
title('Unit Step');
x=[0];
y=[2];
subplot(3,2,6);
stem(x,y);
xlabel('Time');
ylabel('Amplitude');
title('Impulse Function');

Output:

GENERATION OF UNIT STEP FUNCTION AND SEQUENCE

clc;
close all;
clear all;
x=0:1:5;
y=1.^x;
subplot(2,1,1);
plot(x,y);
xlabel('x');
ylabel('u(x)');
title('Unit Step Function');
grid on;
subplot(2,1,2);
stem(x,y);
xlabel('n');
ylabel('u(n)');
title('Unit Step Sequence');
grid on;

Output:

GENERATION OF RAMP SEQUENCE

clc;
close all;
clear all;
n1=input('Enter the length of Ramp Sequence:');
t=0:n1;
stem(t,t);
ylabel('Amplitude');
xlabel('Time');
title('Ramp Sequence');

Input:

Enter the length of Ramp Sequence:5

Output:

GENERATION OF EXPONENTIAL FUNCTION

clc;
close all;
clear all;
n1=input('Enter Sequence Length:');
n=-2:n1-2;
y=10*exp(n);
subplot(2,1,1);
stem(n,y,'fill');
xlabel('n');
ylabel('y(n)');
grid on;
z=5*exp(-n);
subplot(2,1,2);
stem(n,z,'fill');
xlabel('n');
ylabel('z(n)');
grid on;
title('Exponential Sequence');

Input:

Enter Sequence Length:10

Output:

n1 =

10

GENERATION OF SINUSOIDAL SEQUENCE


clc;
close all;
clear all;
n=0:7;
y=10*sin(n);
subplot(2,2,1);
stem(n,y,'fill','--');
xlabel('n');
ylabel('y(n)');
z=10*cos(n);
subplot(2,2,2);
stem(n,z,'fill','--');
xlabel('n');
ylabel('z(n)');
x=10*cos(n);
subplot(2,2,[3,4]);
stem(n,z,'fill','--');
xlabel('n');
ylabel('x(n)');
title('Sinusoidal Sequence');


Output:

GENERATION OF SINE FUNCTION

clc;
close all;
clear all;
t=0:.001:2*pi;
y=10*sin(t);
subplot(2,2,1);
plot(t,y);
xlabel('t');
ylabel('y(t)');
z=10*cos(t);
subplot(2,2,2);
plot(t,z);
xlabel('t');
ylabel('z(t)');
x=10*cos(2*t);
subplot(2,2,[3,4]);
plot(t,x);
xlabel('t');
ylabel('x(t)');
title('Sinusoidal Wave');

Output: